
Contents
- Features
- Available data
- Layout
- Data fields
- Data highlight / line
- Active bar
- Weekly activity distance
- Date
- Golden hour
- Settings on the watch
- Barometer
- Graphs
- Color themes
- Weather
Features
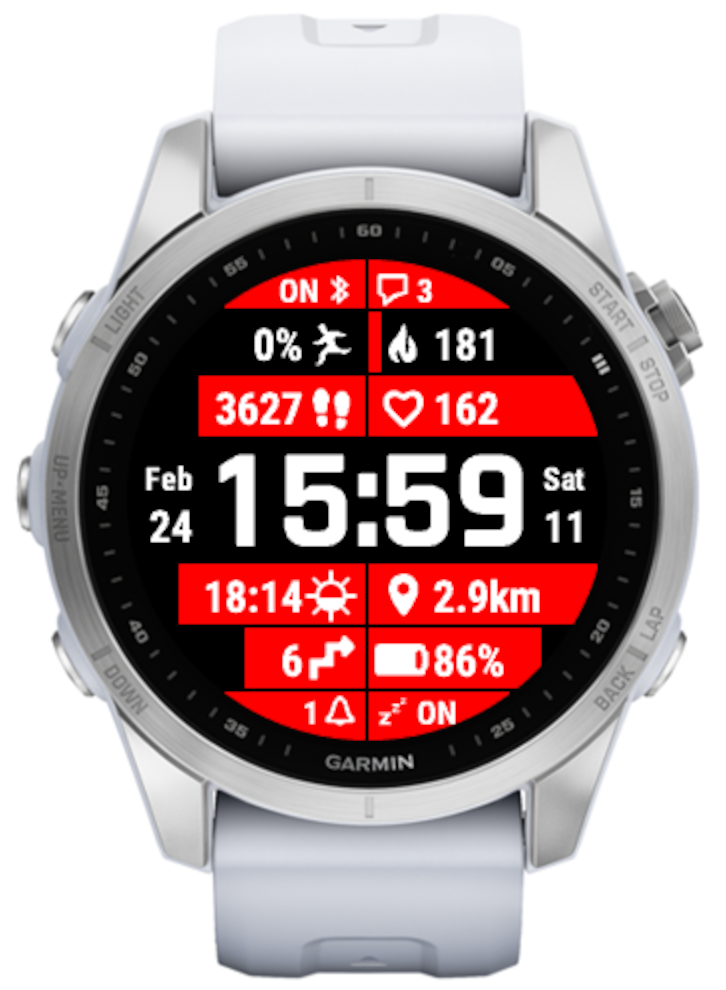
- 16 configurable data fields
- dynamic highlight showing the progress / level of the data
- 40+ color options
- settings on the watch (on compatible devices)
- full AOD on AMOLED devices
- time only/full on gesture power save mode
- Garmin and Openweathermap (OWM) weather
Available data
- phone connection
- notification counter
- active alarm counter
- do not disturb
- battery level
- battery days estimation*
- solar charging*
- activity bar
- steps
- daily distance
- weekly distance
- calories
- active calories
- floors climbed*
- daily active minutes
- weekly active minutes
- heart rate
- heart rate live on gesture
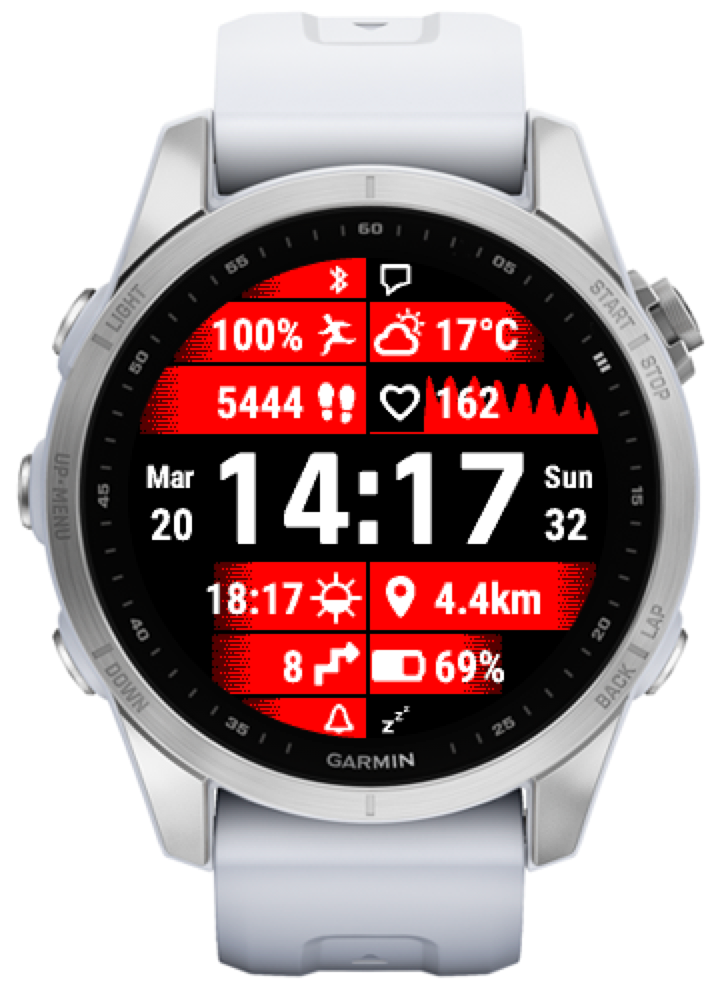
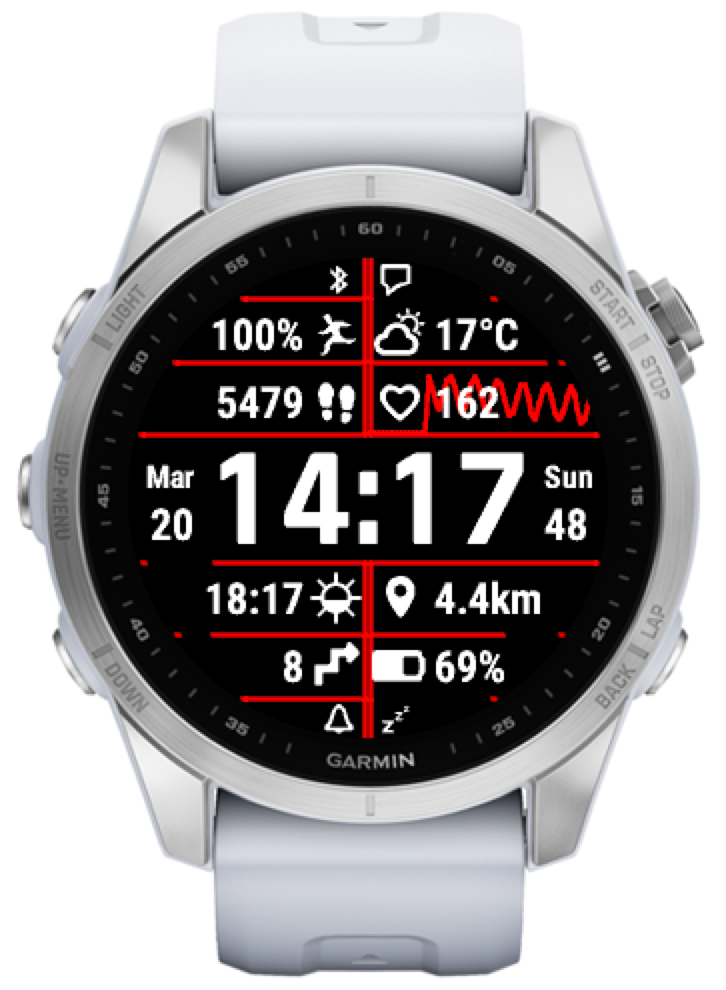
- heart rate graph with adjustable span (1 – 4 hours)
- heart rate range (over the selected span)
- heart rate average (over the selected span) + resting
- oxygen saturation*
- stress*
- stress graph (4h)*
- body battery*
- body battery graph (24h)*
- respiration*
- time to recovery*
- training effect
- VO2 Max run*
- VO2 Max run + cycle*
- Weekly activity distance (run, cycle, swim)*
- Weekly triathlon distance (swim in m or yd, bike and run in km or mi)
- Body weight
- altitude
- climb in meters or feet*
- altitude graph (6h)*
- sunrise/sunset (next, second next)
- golden hour
- moon age (days since last new moon)
- moon illumination in %
- internal sensor temperature with offset*
- barometer (4 types of readings)*
- barometric pressure graph (6h)*
- weather condition
- temperature, temperature range, feels like temperature
- wind speed (m/s, kph, mph, knots, BFT) and direction
- humidity
- chance of precipitation
- UV index
- weather location
- last weather update time
- day of week (ddd)
- day of month (dd, d)
- month (mm, m)
- year (yyyy, yy)
- ISO week number (ww, w)
- AM/PM
- Next calendar event*
* availability depends on device
Layout
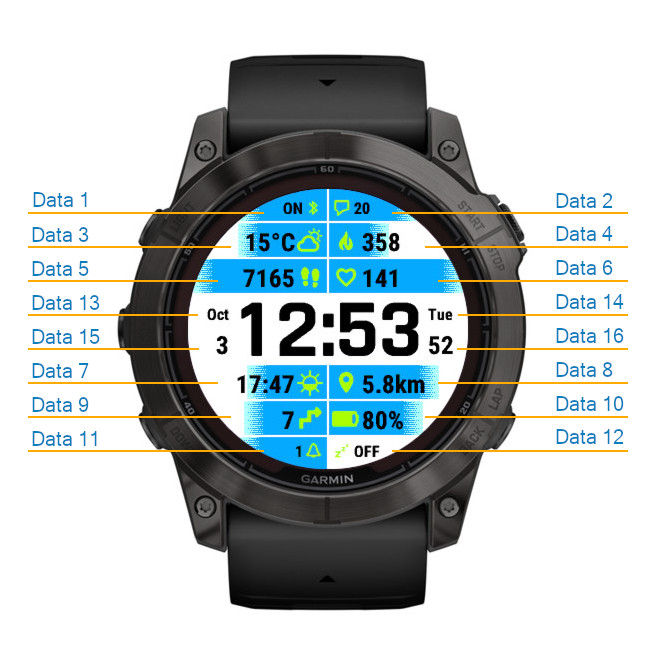
Data fields
There are 16 configurable data fields, divided in 2 groups:
-Main data fields (1-12)
All of these fields offer the same selection of data point, but on the round watches the data may be presented in a different format depending on the space available or how far up or down from the middle of the screen the data is placed.
For example, the wind or the temperature will be shown with or without the unit, or the battery level will be shown with or without the remaining days estimation.
If any of the data fields 1-12 is set to “Off”, the opposite data field will extend to the full width of the screen. This allows to put more emphasis on data important for the user, or to see the level or the graph with more accuracy. When a field is extended to full screen width, it will be presented in its long variant (if available), for example battery level will be shown together with battery days.
It is also useful to display data that may be too long to fit into a regular size field (for example a long date or weather location).
-Side data fields (13-16)
These fields can be used to display date information, or other short data that fits in the limited space on the left and right side of the time.
Data font size for fields 3 – 10 is adjustable. Depending on the device, either it can be slightly reduced by setting ‘Big data font’ to ‘Off’, or it can be selected from 5 size options (XS, S, M, L, XL) in ‘Data font size’ setting. This also applies to the fields 1,2, 11, 12 if the opposite field is set to ‘Off’.
Data highlight / line
For data fields 1-12, the background highlight / line shows the level or progress of the data, for example:
-Steps : Progress towards steps goal
-HR: Current HR reading as compared to the minimum/maximum recorded over the last 4 hours
-Next sun event: Elapsed time until the sun sets or rises
-Altitude: Current reading versus the altitude goal defined in the settings
-Weather: Current temperature vs. minimum/maximum daily forecast
-Notifications: No notifications = no highlight
-Date: Progress from the first to the last day of the week
-Internal sensor temperature: Current temperature vs. minimum/maximum registered by Garmin’s sensor history (typically up to 6 hours)
-Golden hour: Time elapsed from the beginning up to the end of the golden hour
Active bar
This is the opposite of the standard move bar – it is 100% when you are active, and gradually goes down to 0% when you are not moving. To get it back to 100% you need to move for a while.
Weekly activity distance
This field is meant to display the weekly distance of 3 types of recorded activities (run, bike, swim). But the actual data is subject to the limitations of the Garmin system.
There are two modes for this data field:
1. This week
On compatible devices (generally the newer ones), in this mode the run and bike distance will show data registered by all devices used, for example if a bike computer is used for cycling activities instead of the watch. The swim distance will still come only from the watch on which Gradient is running.
2. Last 7 days
In this mode it is only possible to display the data registered on the watch on which Gradient is running.
Date
There are two ways to display date – individual date components in the fields 13-16, or as a single data field 3-10.
For fields 13-16, these options are possible:
-day without leading zero (d)
-day with leading zero (dd)
-day of the week (ddd)
-month without leading zero (m)
-month with leading zero (mm)
-month name (mmm)
-2 digit year (yy)
-4 digit year (yyyy) (*on some devices only)
-ISO week without leading zero (w)
-ISO week with leading zero (ww)
-AM/PM
Date shown in the fields 3-10 is fully configurable, using the ‘Date format’ field in the settings. This field has to be configured using Garmin’s app (Connect IQ or Express).
To configure the date, you need to enter any of the following letters in the ‘Date format’ setting:
d = day number without leading zero
D = day number with leading zero
m = month number without leading zero
M = month number with leading zero
y = 2-digit year
Y = 4-digit yearn = day name (according to system language)
N = month name (according to system language)
w = ISO week number without leading zero
W = ISO week number with leading zero
a = AM/PM
Any other character (e.g. – / : . []) will be displayed if it is available on the watch.
For example, you can use the following formats:
“n N d” → Fri Aug 24
“n D.M” → Fri 24.08
“d/m [W]” → 24/8 [34]
“Y\M\D” → 2018\08\24
“m-d-y” → 8-24-18
“n D (w)” → Fri 28 (34)
The highlight/line for the date field shows progress towards the end of the week, according to the ‘first day of the week’ set in Garmin Connect User Settings.
Golden hour
The golden hour is defined as the period when the sun’s position moves between -4.0 to + 6.0 degrees above the horizon. The value shown is the end of the golden hour in the morning and the beginning of the golden hour in the evening. In addition, the highlight/line progress indicator shows the sun’s movement from the beginning to the end of the golden hour.
Settings on the watch
On supporting devices, it is possible to configure many features directly on the watch, using the ‘Customize’ function. This applies to the selection of data for data fields and other display configuration such as colon, leading zero, or the color themes. This is convenient for making quick changes without the need to reach for your phone.
Some settings are only available through the Garmin app (goals for calories, distance and altitude, alternate time zone offset, pressure units, temperature offset, HR monitoring duration, date format, unlock key). In general these are the settings that would be very cumbersome to enter directly on the watch.
Barometer
There are 4 options provided, using different Garmin API:
1) raw: Ambient (local) barometric pressure as measured by the internal pressure sensor. The data is the temperature compensated information read directly from the internal sensor.
2) ambient: Ambient (local) barometric pressure as measured by the pressure sensor. The data is smoothed by a two-stage filter to reduce noise and instantaneous variation.
3) sea level: Barometric pressure calibrated to sea level. Since pressure varies dues to several factors, a GPS-based altitude must first be obtained, then the ambient (local) pressure is measured by the pressure sensor before conversion to a calibrated barometric pressure value.
4) history: Pressure read using Sensor History Iterator. Garmin does not seem to specify what kind of reading this is (or I have not managed to find it in the documentation), but based on empirical tests it is likely to produce closest results to Garmin’s barometer widget readings.
The pressure unit setting is only accessible through Garmin app.
Graphs
The HR graph time span can be adjusted between 1 and 4 hours and the graph is dynamically scaled according to the min/max HR during that time.
This allows a more detailed view than in Garmin’s widget.
For the other graphs, the duration is fixed:
Stress – 4 hours
Body battery – 24 or 12 hours (depending on the device)
Altitude – 6 hours
Pressure – 6 hours
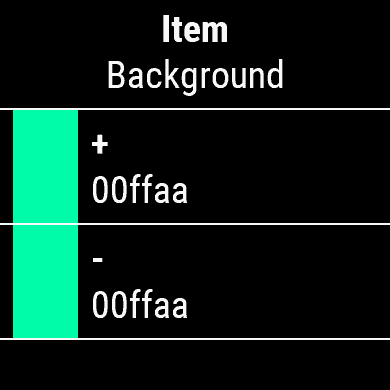
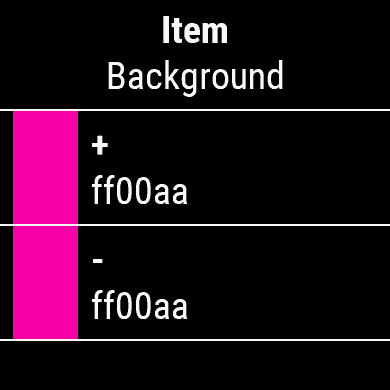
Color themes
There are 40+ predefined color themes that can be easily switched directly on the watch (on supporting devices).
For further customization, it is possible to override the colors of individual theme elements (time background, hours, minutes, colon, data fields 13-16, data background and foreground, icon and text).
The custom colors are saved for each theme separately.
NOTE: Because of the way the Connect IQ app settings work, you can’t select another theme and customize its colors at the same time. After changing the theme, you must save the settings first, and only then open the settings again to apply customization. If you use Garmin Express to do this, you must disconnect the USB after changing the theme, then connect again to customize it.
If the configuration is done in Garmin’s app, the custom colors need to be entered in Red/Green/Blue hex format (RRGGBB).
The map below gives a rough guide, but on some devices with more graphic capabilities you should be able to enter many more colors.

To reset the custom colors, just clear the corresponding settings fields.
If the configuration is done on the watch, you can cycle through the color map by tapping the + or -. The currently selected color will be shown together with the corresponding hexadecimal code.
There are 5 “Color modes”:
NOTE: On AMOLED devices the ‘Highlight’ and ‘Gradient’ modes are not available in Always On Display (AOD) because of the restrictions Garmin imposes on the number of pixels that can be illuminated simultaneously. If one of these modes is used, it will fall back to ‘Icon’ mode in AOD.
Weather
There are two choices of weather data source – Garmin or Openweathermap (OWM). Garmin will only work on the supporting devices.
For OWM to work, you will need to put your API key in the settings.
Please note that not every key will work.
OWM API key created with the free “Current weather and forecasts collection” subscription after mid-2022 will not work due to OWM policy changes. If you have a key created earlier, it should work.
Alternatively, you can subscribe to “One Call by Call” subscription plan for One Call API 3.0. This subscription comes with 1,000 API calls per day for free, and Gradient will not exceed 200 calls per day.
Update frequency
Garmin weather updates as often as Garmin decides to refresh it – it seems that it can be anything between 10 minutes to 1 hour.
OWM weather updates every 15 minutes. Note that this is the frequency at which this app queries new weather data, but it does not guarantee that OWM will update the data at their end within that period.
Temperature range
When Garmin weather is selected, this shows the forecasted high and low temperatures for the day.
When OWM weather is selected, this shows the forecasted high and low temperatures for the next 3 hours. At the moment it does not seem possible to have the full day temperature range forecast using a free API key. This is because the full day forecast data delivered by OWM is too large for Garmin devices to process.
Hello,
Please see https://reed.works/unlocking/
Hello
How can I get a key?
Please see: https://reed.works/common-problems/
How to choose 24h time mode instead of 12h?
Cześć, dzięki
To jest wyjaśnione na stronie pobierania
1) wybierz UA color theme, albo
2) https://reed.works/gradient-unlock/
Cześć, super tarcza ale czas zniknął. Jak odblokować?
Bitte prüfen Sie, ob Ihr Freischaltschlüssel noch in den Einstellungen vorhanden ist. Wenn nicht, kopieren Sie es zurück.
Wie bekomme ich das Schlüsselsymbol weg?
Il y a eu un problème avec la compensation du fuseau horaire, mais il devrait être résolu dans la dernière version. Le problème persiste-t-il ?
Hi, thank you for your message! Is your watch an Asian variant?
Hi, looks very comprehensive and customisable!
Would be very keen to unlock if it enables me to see stress, respiration (breaths per minute) and body battery. Have selected those 3 for the 12 main fields but it’s not displaying the data (numbers) though the icons are there. Other data like heartrate, golden hour and active calories are displayed with numbers.
Am using a forerunner 245 music, if it matters!
Thank you for your comment. Please read the description on the download page.
Great watch face but the key sign instead of the time on the screen does not disappear after exiting sleep mode n dont know how move it back.please help
Le ISO pour la semaine n’est pas exacte ma semaine commence lundi et elle indique 10 ça devrait être 11
Great watch face. Love it!
Thanks.
Hugh L
Time disappeared. How to Unlock and cost?
Hi. Thank you for your comment. How long ago was your key created? It may take some time before a newly created key becomes active.
Hi. I love this watch face but even i try one call API key 3.0 its doesn’t works.