What’s new
New options for the ‘Bottom field’:
Now it is possible to choose one of the weekly activity graphs:
- active minutes
- calories
- distance
- floors climbed
- steps/wheelchair pushes
These graphs display bars for 8 days. The first bar on the right corresponds to today, and the first bar on the left corresponds to one week ago.
The image below shows distance graph. So the numbers describing the graph are kilometers or miles.
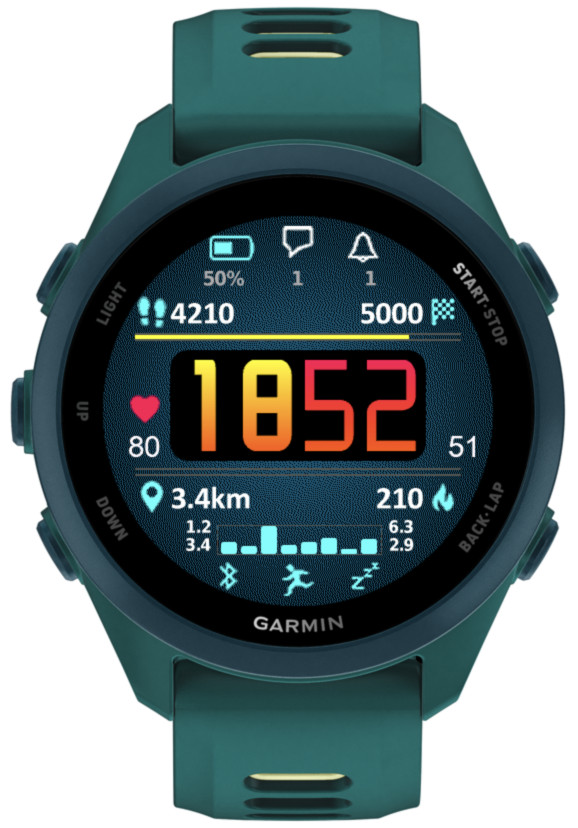
There are 4 numbers shown around the bar graph:
Top left – minimum value recorded in 8 days
Top right – maximum value recorded in 8 days
Bottom left – current value
Bottom right – average value over last 8 days
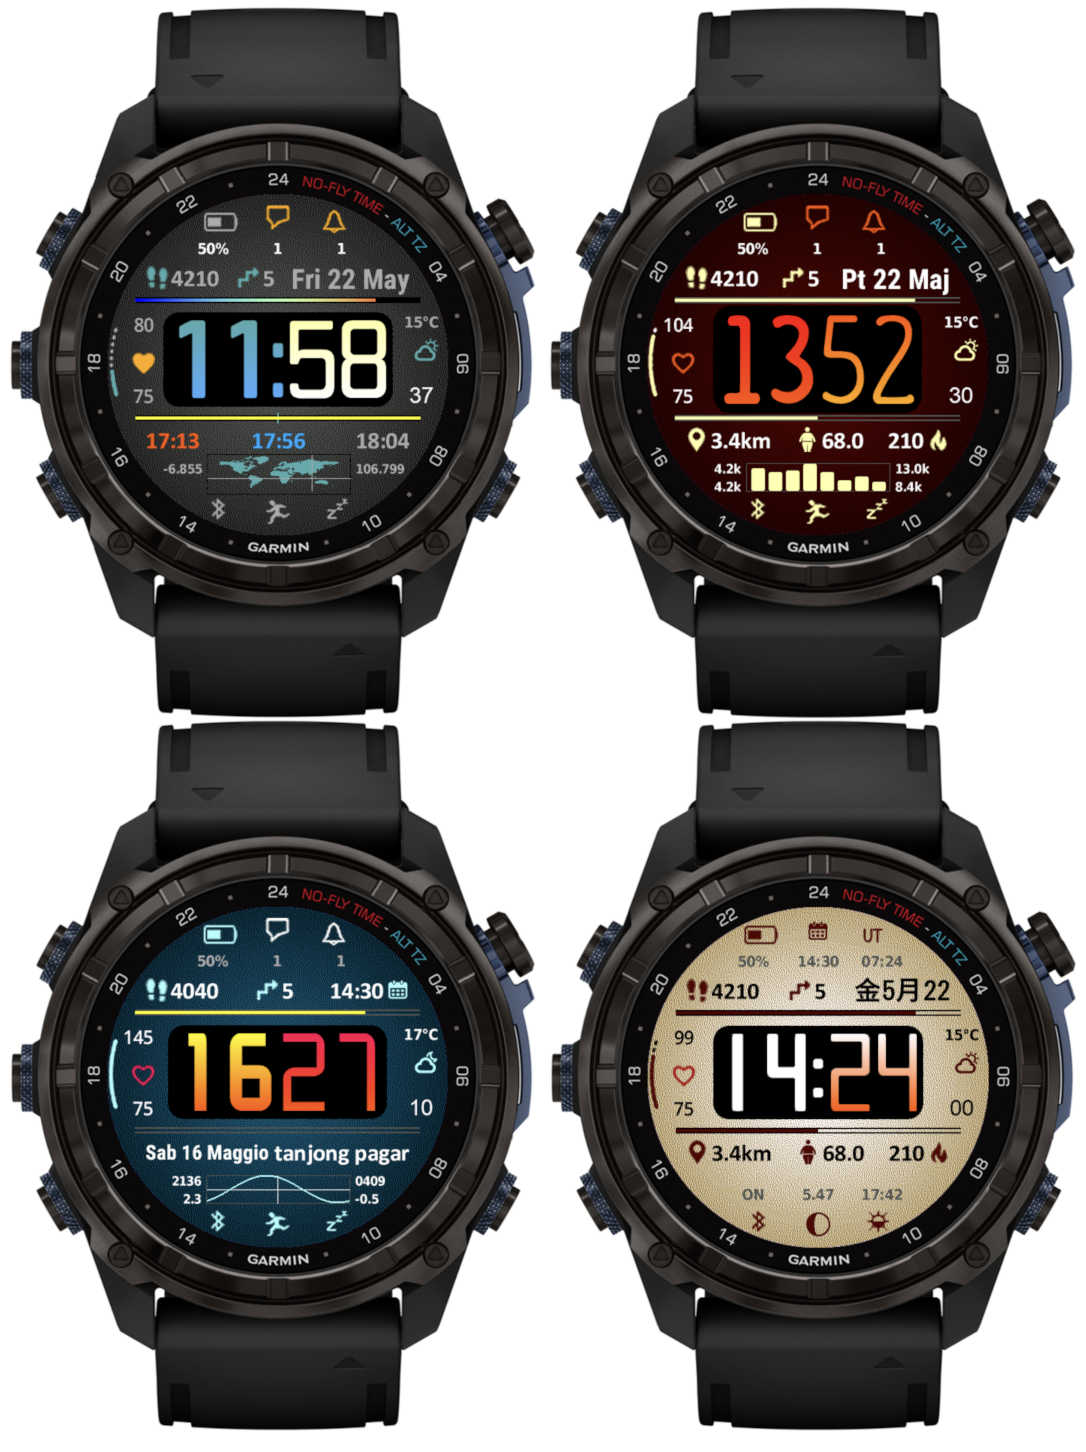
Another new option is tide information from stormglass.io
For this to work, you must enter in the settings your stormglass.io API key (it is free for the amount of data pulled by this watch face)

It includes these data points:
Next tide (level + time)
Second next tide (level + time)
Tide station name (if available)
Tide graph in Bottom field
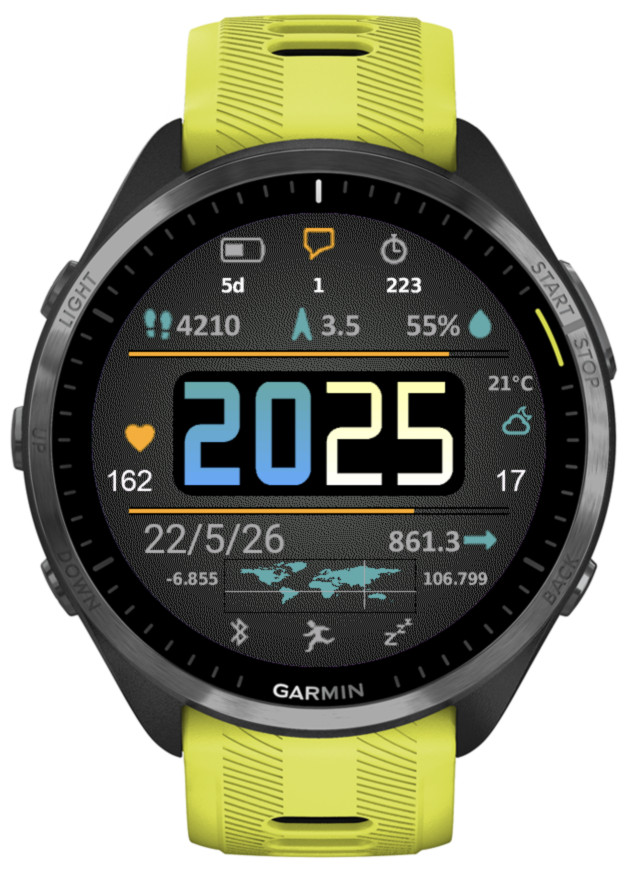
There is an option in the settings to specify the coordinates for the tide information (in Decimal Degrees: e.g. -6.600000, 106.800000).
You can also display your current coordinates together with a world map showing where you are