What’s new
Data points
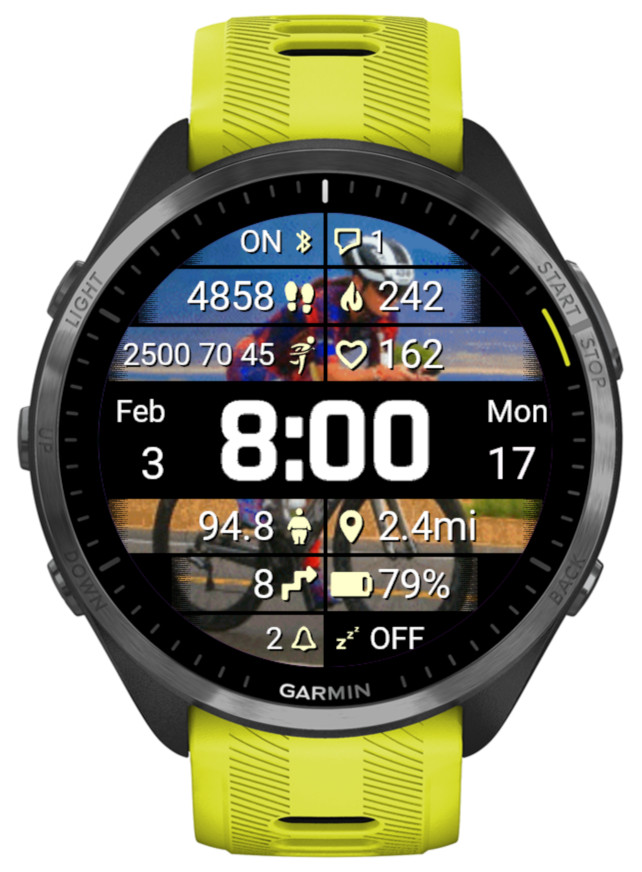
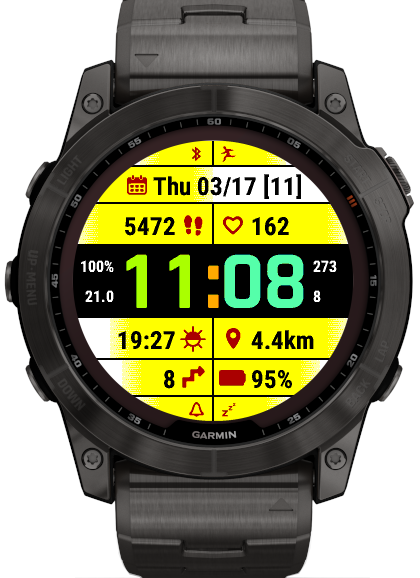
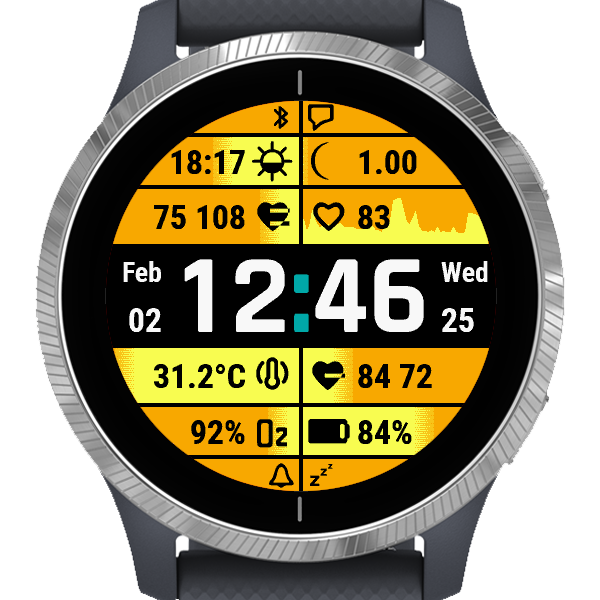
- Weekly triathlon distances (swim [m/yd], bike [km/mi], run [km/mi])
- Body weight according to User Profile [kg/lb]
- Temperature + Feels like temperature
- Stress + body battery together
Wallpaper
- Img5

IMPORTANT: This release freezes the development on the older generation of devices that do not have enough onboard memory to allow adding new features.
These include:
* fenix 5 family (all variants plus derivatives like quatix, D2 etc)
* fenix 6s variants
* Forerunners before 255/955
* Venu Sq
* vivoactive 3
* MARQ (1st gen)
There will only be maintenance updates to fix bugs or to adapt to external changes (e.g. OWM policies).
The new features listed below appear only on the devices capable of accommodating them:
Previously there were only two sizes, controlled by the settings option ‘Big data font’ (On or Off).
Now, this option is renamed to ‘Data font size’, and it allows the choice of XS, S, M, L, XL.
This applies to fields 3 – 10, and to 1, 2, 11, 12 if the opposite field is Off.
Note that on some devices your font may increase in size after updating to this version. Don’t be alarmed, just select the size you want again.
It can be selected as an alternative to moon age, with the same moon phase icon, or it can be displayed together with the moon age.
An option was added to show the weekly activity distance for the last 7 days instead of the current week.
NOTE: This post also covers the new features added in the version 3.3.0.
• Training effect
There is no separate new option for Training Effect, but it is appended to Recovery Time in the data fields 3 – 10, or in the data fields 1, 2, 11, 12 if they are set to occupy the whole width of the screen by switching the opposite field to ‘Off’.
• Launching widgets by screen touch enabled by default
If you prefer them not to be launched, set ‘Widget launch’ to ‘Off’.
• New color mode
The previous ‘Highlight’ mode was renamed to ‘Gradient’. The new ‘Highlight’ mode works pretty much the same as the old one, but it has a sharp edge.
• Options to configure AOD icon and text color
In AOD mode each color theme sets the icon and text color automatically for the active color theme. But if you prefer different colors, now you can define them here.
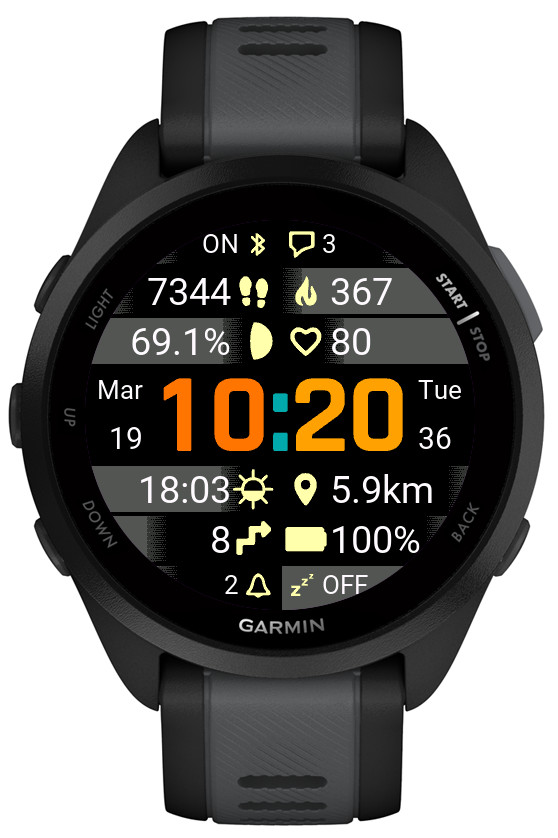
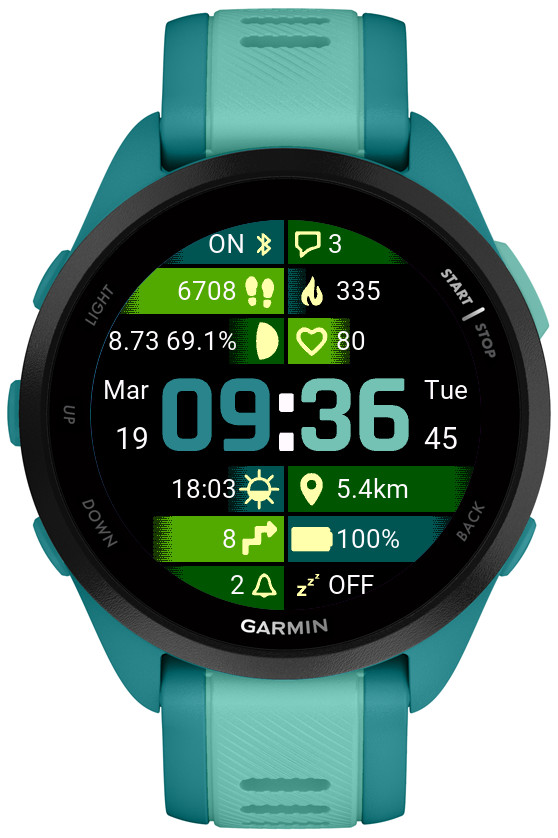
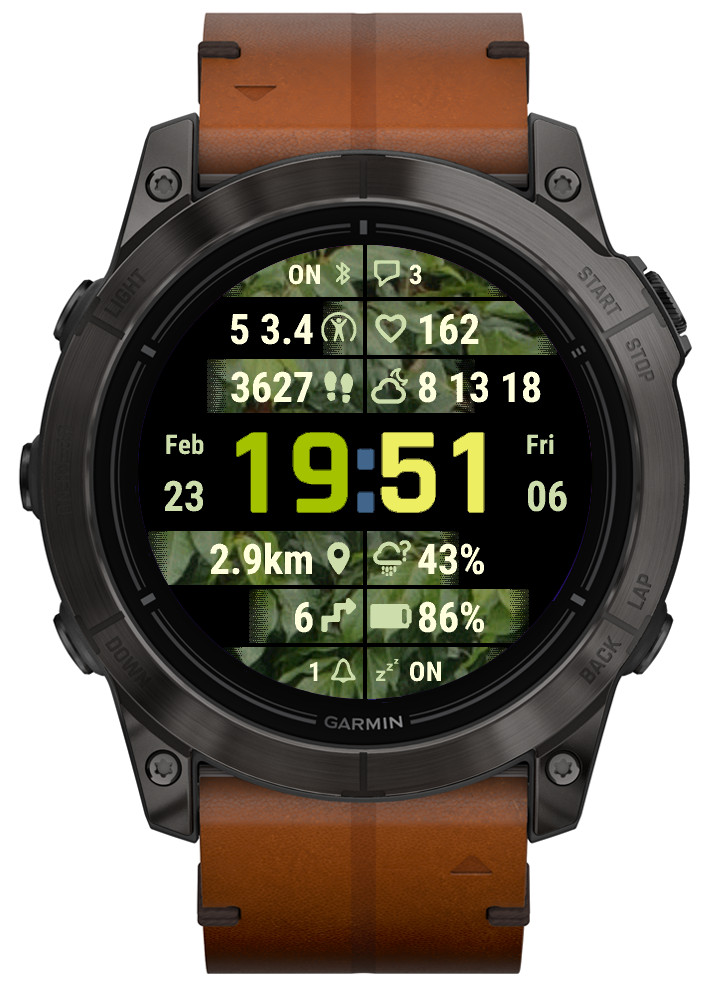
• New color themes on compatible devices
4 new Color options: Img1 – Img4.
They only make a difference in ‘Highlight’ or ‘Gradient’ color modes.
Instead of color combinations used in other themes, they use wallpaper images (currently Leaves, Flowers, Wood, Sky) for the data level/progress highlight.


The duration of the stress graph is 4 hours (updated every 3 minutes) and altitude graph 6 hours (updated every 2 minutes).

This is controlled by a new setting ‘Big data font’ (by default ‘On’).
On most devices a smaller font option has been added which can be activated by setting ‘Big data font’ to ‘Off’. This allows longer data to fit better on the screen.
However, on some devices which come with enormously large system fonts (Venu family, Forerunner 265 and 965), the smallest available font was used already, so the only possible option was to add a larger font. The effect of this is that after update your fonts will appear bigger, which may be useful for those who want better readability. Otherwise, to revert to the previous size, set ‘Big data font’ to ‘Off’.

NOTE: Apparently currently many devices with System 5 on it are not able to display this data. If you don’t see it showing on your watch even though you have System 5, please wait for a firmware update from Garmin.


There are two graph options:
1) HR graph
Shows the graph with the current HR reading that is updated once a minute (less battery drain).
2) HR graph + live
Shows the graph with the current HR reading that is updated once a minute or every second on gesture (more battery drain).
The graph time span is adjustable between 1 and 4 hours (this setting is only available through the Garmin app).
The graph level adjusts dynamically to the current minimum and maximum recorded over the selected time span, so it is easy to see the variation.
This shows the minimum and maximum HR reading during the graph time span selected.
This shows the average HR value calculated over the graph time span plus the resting HR, which is either a seven day average resting heart rate (on CIQ 3.2.0 or higher), or the resting heart rate available before CIQ 3.2.0.
If a data field is set to ‘Off’, the opposite data field will take the whole width of the screen.

The offset setting is only accessible through Garmin app.
There are 4 options provided, using different Garmin API:
1) raw: Ambient (local) barometric pressure as measured by the internal pressure sensor. The data is the temperature compensated information read directly from the internal sensor.
2) ambient: Ambient (local) barometric pressure as measured by the pressure sensor. The data is smoothed by a two-stage filter to reduce noise and instantaneous variation.
3) sea level: Barometric pressure calibrated to sea level. Since pressure varies dues to several factors, a GPS-based altitude must first be obtained, then the ambient (local) pressure is measured by the pressure sensor before conversion to a calibrated barometric pressure value.
4) history: Pressure read using Sensor History Iterator. Garmin does not seem to specify what kind of reading this is (or I have not managed to find it in the documentation), but based on empirical tests it is likely to produce closest results to Garmin’s barometer widget readings.
The pressure unit setting is only accessible through Garmin app.