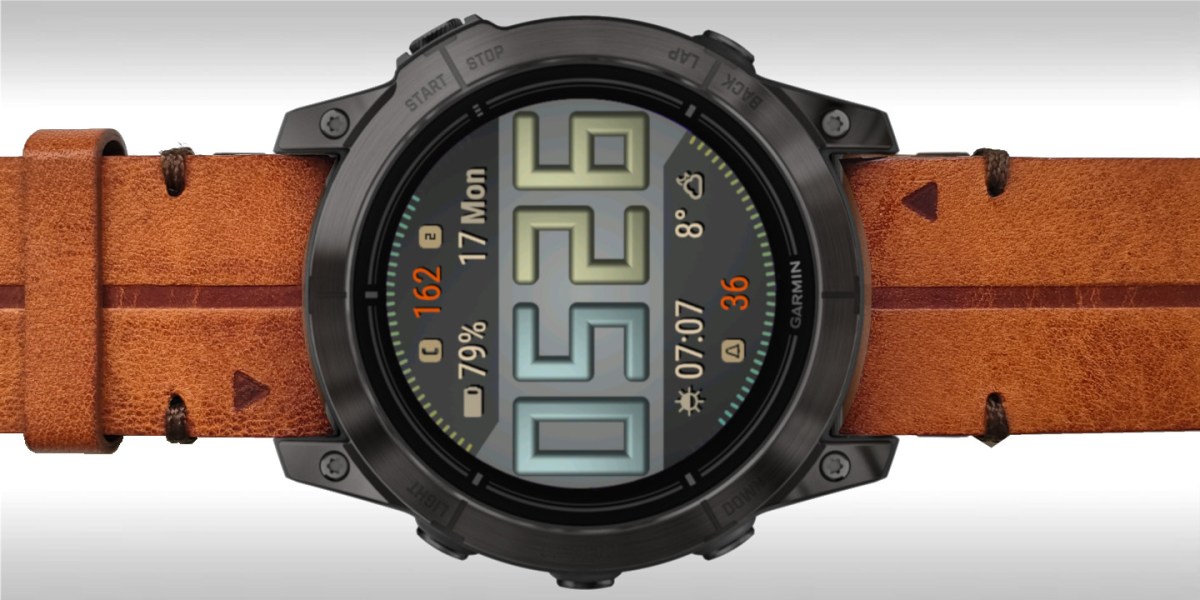
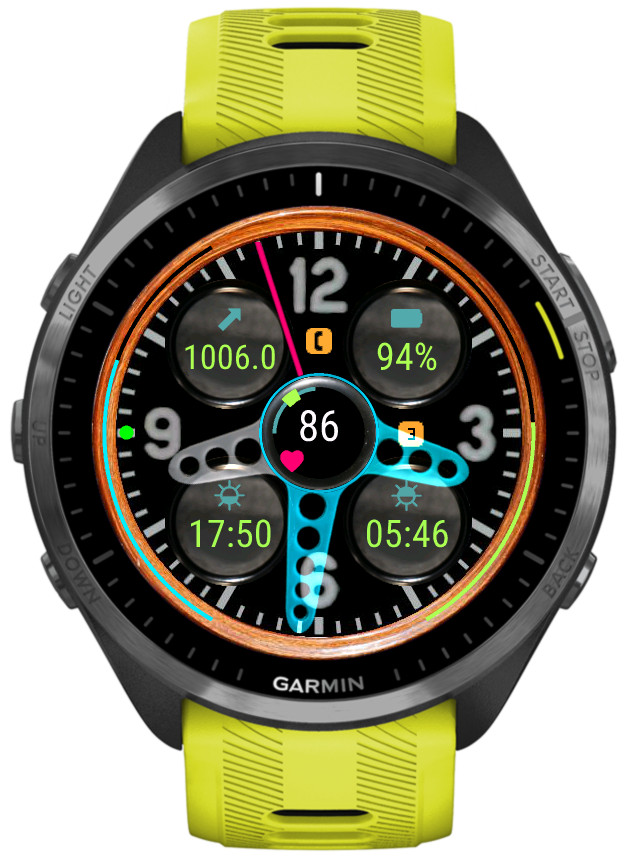
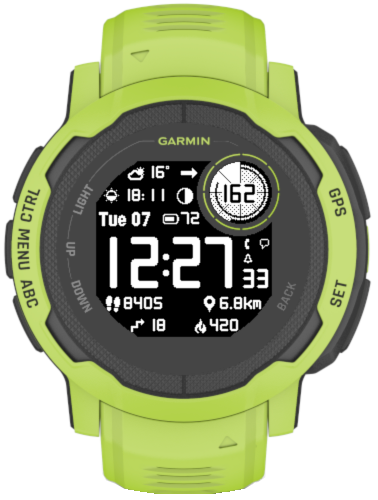
A watch face inspired by a classic car dashboard with wide choice of data options
6 customizable color themes
5 data fields
4 gauges
50+ data points (depending on the device)
4 status icon fields
4 configurable data sets (switchable by touch, on the watch settings or Connect IQ)
Extra hand for UTC or alternate zone time
4 AOD modes with 3 brightness levels
Data sets
For easy access to more data than can be simultaneously shown on the screen, it is possible to switch between 4 ‘data sets’. Each set contains its own setup of data fields, gauges, icons and extra hand.
Switching between sets can be done in Garmin Connect IQ app, in the watch face ‘Customize’ menu, or by touching the 12, 3, 6, 9 hour marks (if enabled in the settings).
If switching by screen touch is enabled, an indicator dot will appear on the corresponding hour mark to show which data set is currently active.
The 4 sets are predefined with the focus on general, basic health tracking, fitness, weather. But each set can be fully configured to your needs and the configuration will be kept while you switch between sets.
Color themes customization
The colors of different screen elements are customizable, however for the hands the customization color does not replace the basic color but adds to it.
The colors are entered in the RGB hexadecimal format where each two hex digits correspond to the Red, Green and Blue component level.
Weather
The weather source can be either Garmin or Openweathermap (OWM). OWM is generally more accurate and provides some options that Garmin does not. However, in order to use it, you need to provide your own OWM API key (3.0 compatible).
Unlocking
This watch face is fully functional without payment. However, some options will trigger a floating padlock icon if they are used without a valid unlock key. These options are marked with a ‘star icon’ in the settings and include:
-switching data sets -switching color themes -changing AOD brightness -applying hands blending mode -‘live’ HR and solar charging -extra hand
The options depend on what sensors are available on your device.
At most you will get:
-HR (up to 6 hours) -SpO2 (up to 8 days) -Body battery (up to 24 hours) -Stress (up to 4 hours) -Watch temperature (up to 6 hours) -Barometric pressure (up to 6 hours) -Elevation (up to 6 hours)
The graphs can be zoomed in/out and scrolled left/right.
Several graph styles are possible, depending on the device.
Some options can be adjusted directly on the watch by pressing the menu button.
Besides the graph, the timestamp of the first and last sample of the current span is shown, as well as the duration in seconds between samples.
Operation
Operation is very simple:
1) Use the Select button or a screen tap to switch between Select/Zoom/Scroll modes (depending on the device input capabilities)
2) Use the Up/Down buttons or swipe up/swipe down to move in the currently selected mode
On top of that, the basic settings (Graph style, Glance/Preview span, marker lines) are accessible by the Menu button while in the main display (so it won’t work when you are in glance or preview).
Graph styles
Line
Area
Colors
Color mapping depends on the type of the graph:
HR: according to the sport for which the current activity retrieves heart rate zone thresholds, or ‘generic’ if there is no activity:
zone 1 – gray, zone 2 – blue, zone 3 – green, zone 4 – yellow, zone 5 – red
This app has two additional copies on the store. If you install them, you can display multiple glances showing different data configurations simultaneously.